
Hierarchical HEALPix output#
We write output in multiple resolutions (hierarchical) on the HEALPix grid in order to simplify and speed up analysis. In order to take advantage of this particular output format, it is necessary to know about some particular properties of this representation. As HEALPix and hierarchical data structures are in principle independent, we’ll introduce them separately. But we’ll see that both fit together quite snugly.
Usage examples
Hierarchical Output#
In this context, hierarchical output means multiple copies of the output at different resolutions.
A combination of hierarchical output and chunked storage allows to access data such that the amount of data required to load scales with the size of the screen, plot or analysis domain instead of with the size of the model. In general, this enables fast analysis of high resolution model output.
A spatial hierarchy can probably be best illustrated with how online map services work:
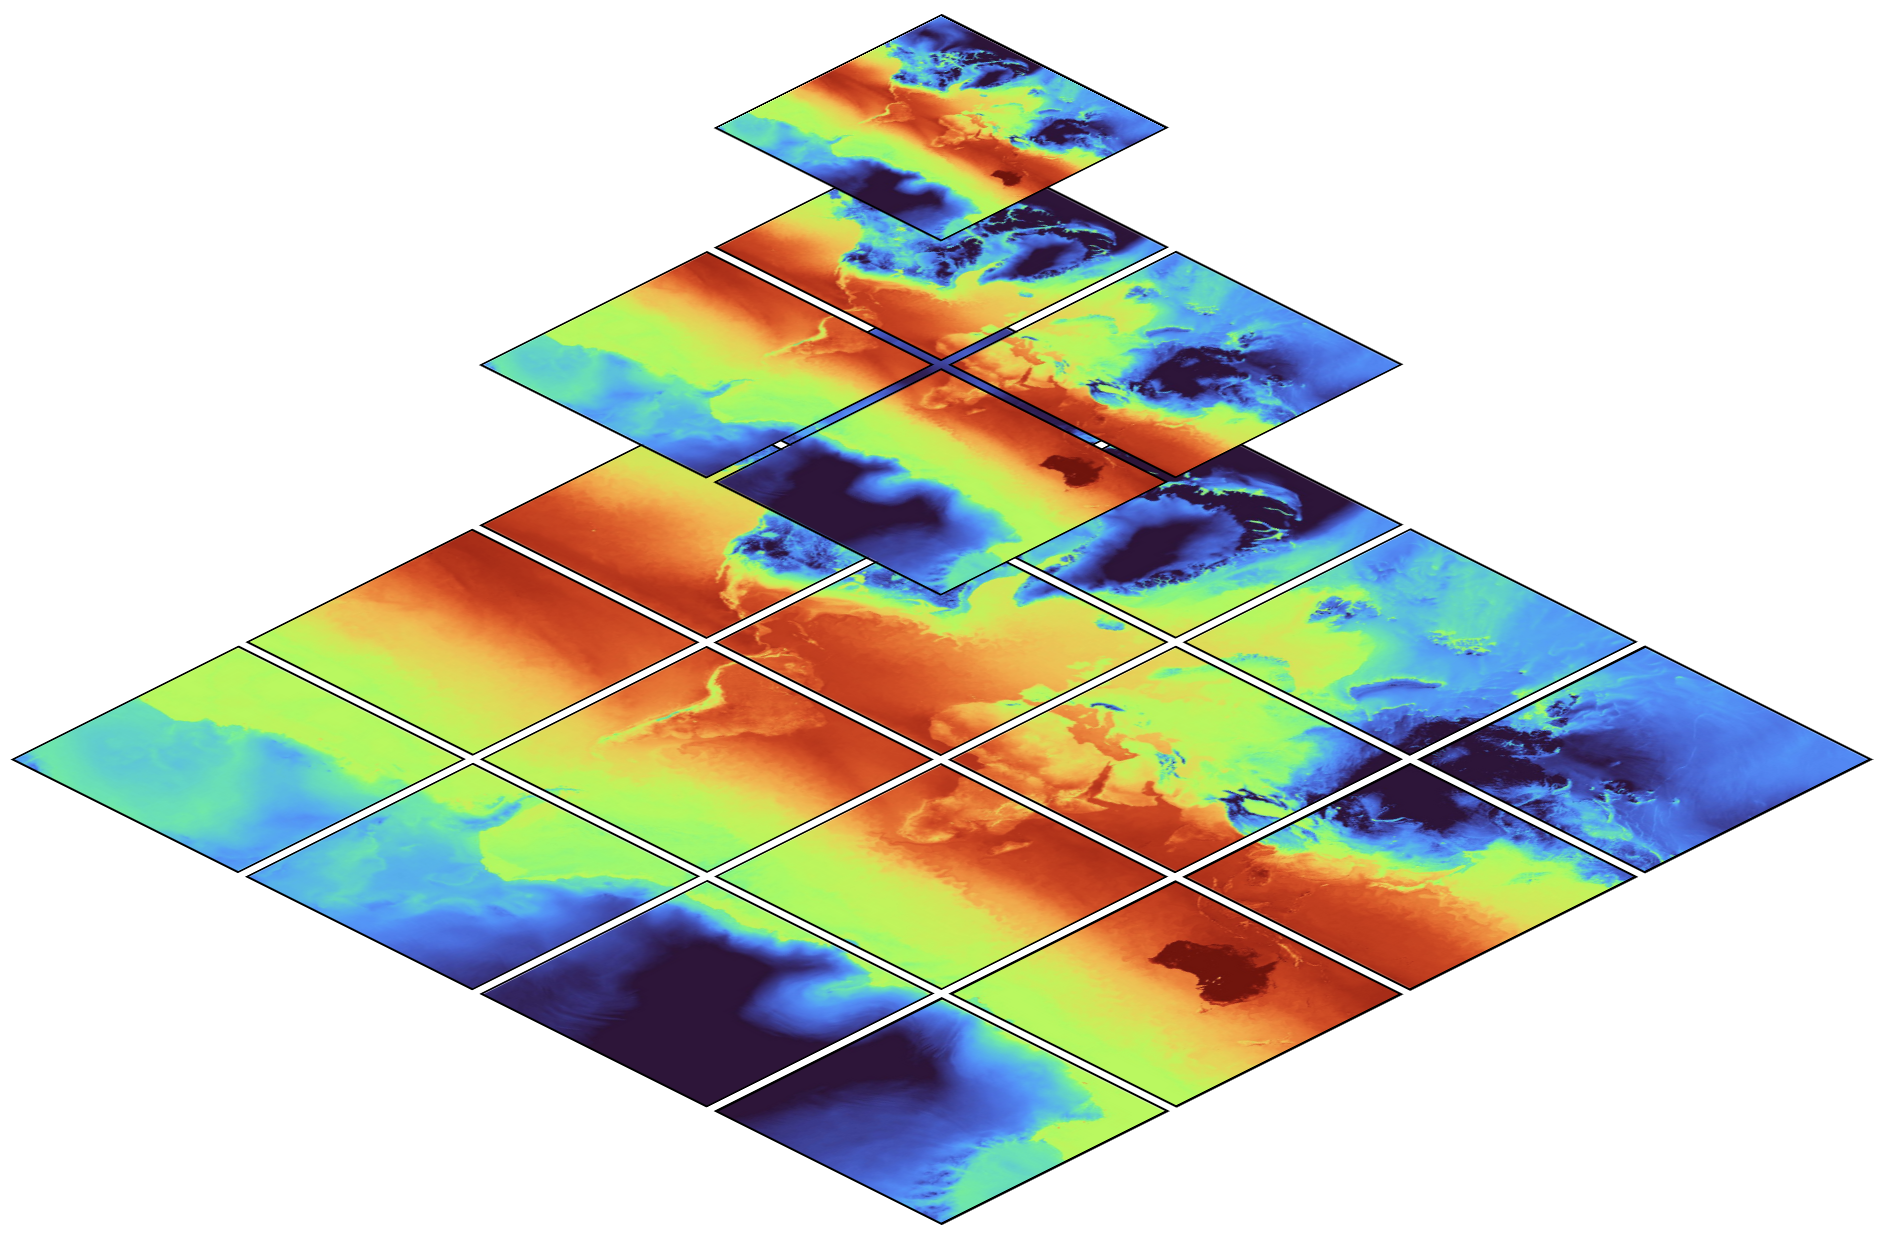
The map shows global temperature distribution[1], at multiple
resolutions. The top level (z = 0, whereby \(`z`\) denotes the zoom),
contains only a single image (data chunk) at coarse resolution. The
second level (z= 1), contains four images (chunks) at double the
horizontal resolution. The third and any further level continues in the
same manner.
With this structure, a user (or a library) can select a zoom level
appropriate for the current region of interest (e.g. 12 for a map of
Hamburg or 5 for central Europe or even 0 for global means), but no
matter of the chosen zoom level, the amount of data required to load
stays approximately constant.
While hierarchical datasets can dramatically speed up analysis, it’s interesting to note that not much more storage space is required: as visible in the figure above, all coarser levels combined are much smaller than only the finest level.
A similar hierarchical structure can be built for temporal aggregation: if data is stored e.g. in 30 minute, 3 hour and daily intervals, one can select an aggregation interval appropriate for the chosen form of analysis. By e.g. using daily data instead of 30 minute data, 48 time less data has to be loaded.
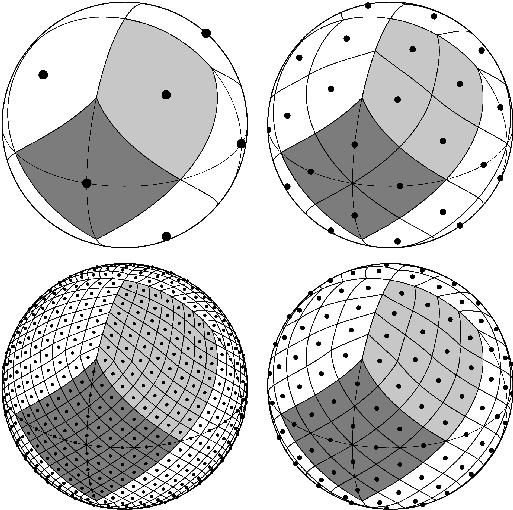
HEALPix#
The HEALPix (Górski et al., 2004) grid is a pixelation of a sphere, designed to support hierarchical structure, be (exactly) equal area and iso-Latitude. It’s also based on quadrilaterals. To get a first impression of the grid, you might want to check out a grid viewer. The grid is defined by a set of equations, which often can make grid point querying operations very fast, e.g. there is a function to compute (instead of look up) the grid cell number given a pair of longitude and latitude. These functions are implemented in the HEALPix Software Package which comes with bindings in various languages, including the healpy Python package.
HEALPix spatial resolution#
HEALPix grids comprise \(12\cdot 4^z\) cells with \(z\) a non-negative
integer denoting the zoom level (or nest). The surface area of the
earth is \(510\times10^6\) square kilometers. A regular \(1^\circ\)
lat-lon grid would correspond to a grid cell with an area of about
\(111\times 111\) km \(^2\) at the equator, or 79 km of longitude at
\(45^\circ\) of latitude. An equal area grid with the same cell size as
a \(1^\circ\) lat-lon grid at the equator would have 41156 grid cells.
The closest HEALPix grid has \(z=6\) which consists of 49152 tiles.
HEALPix \(z\) |
\(\\sqrt{A}\) / km |
number of latitudes |
eff. ang. resolution |
|---|---|---|---|
0 |
6519 |
3 |
\(60^\circ\) |
6 |
101.9 |
255 |
\(0.7^\circ\) |
8 |
25.5 |
1023 |
\(0.18^\circ\) |
10 |
6.4 |
4095 |
\(0.04^\circ\) |
12 |
1.6 |
16383 |
\(0.01^\circ\) |
ICON uses R\(n\)B\(m\) grids, corresponding to \(20 n^2 4^m\) cells. We usually use the \(n=2\) family of grids for which there are \(20 \cdot 4^{m+1}\) points. This means that the R2B9 grid has 20,971,520 cells and, more generally, that the R2B\(m\) family of grids have 5/3rds as many points, or \(\sqrt{3/5}\) the lengthscale, as a HEALPix grid with \(z=m+1\). Hence the \(z=10\) grid is often used as the base grid for mapping from R2B9.
Rules of thumb
For many global applications, especially when comparing to standard data sets, a \(z=5\) grid will suffice
For zonal averages choosing \(z=6\) gives better than 1 \(^\circ\) resolution
For near native resolution, choose \(z=m+1\), i.e. \(z=10\) for the NextGEMS cycle 3 runs.