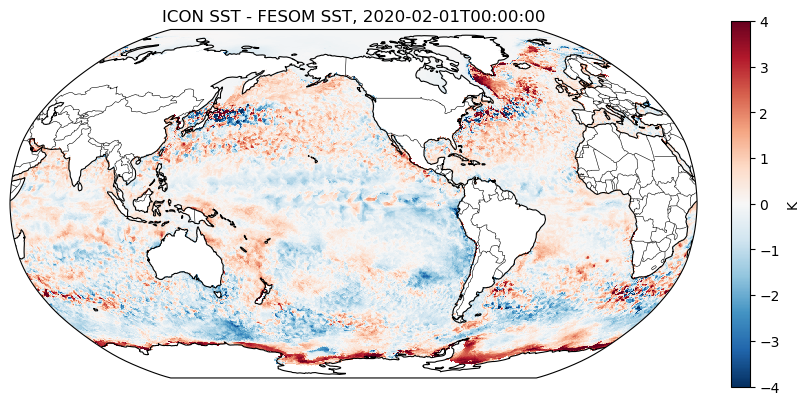
Plot the difference between two fields on (possibly) different grids#
Currently healpix data and fields with associated lon, lat coordinates (in degree) are supported.
import intake
import cartopy.crs as ccrs
import cartopy.feature as cf
import healpy as hp

import matplotlib.pyplot as plt
import numpy as np
from scipy.spatial import KDTree
Load the datasets and select 2d slices for the plot#
cat = intake.open_catalog("https://data.nextgems-h2020.eu/catalog.yaml")
icon = cat.ICON["ngc3028"]
fesom = cat.FESOM["IFS_4.4-FESOM_5-cycle3"]
time = "2020-02-01T00:00:00"


fesom_2d = fesom["2D_1h_native"].to_dask().sst.sel(time=time, method="nearest")
print(f"Found {str(fesom_2d.time.values)[:19]} as closest timestep in the fesom data.")
icon_2d = (
    icon(time="P1D", zoom=7)
    .to_dask()
    .to.sel(time=time, method="nearest")
    .isel(depth_full=0)
)

print(f"Found {str(icon_2d.time.values)[:19]} as closest timestep in the icon data.")
Found 2020-01-31T23:56:00 as closest timestep in the fesom data.
Found 2020-02-01T00:00:00 as closest timestep in the icon data.
Helper functions that sample the 2d fields at image pixels#
def get_nn_data(var, nx=1000, ny=1000, ax=None):
    """
    var: variable (array-like)
    nx: image resolution in x-direction
    ny: image resolution in y-direction
    ax: axis to plot on
    returns: values on the points in the plot grid.
    """
    lonlat = get_lonlat_for_plot_grid(nx, ny, ax)
    try:
        return get_healpix_nn_data(var, lonlat)
    except ValueError:
        pass
    if set(var.dims) == {"lat", "lon"}:
        return get_lonlat_meshgrid_nn_data(var, lonlat)
    else:
        return get_lonlat_nn_data(var, lonlat)


def get_healpix_nn_data(var, lonlat):
    """
    var: variable on healpix coordinates (array-like)
    lonlat: coordinates at which to get the data
    returns: values on the points in the plot grid.
    """
    valid = np.all(np.isfinite(lonlat), axis=-1)
    points = lonlat[valid].T  # .T reverts index order
    pix = hp.ang2pix(
        hp.npix2nside(len(var)), theta=points[0], phi=points[1], nest=True, lonlat=True
    )
    res = np.full(lonlat.shape[:-1], np.nan, dtype=var.dtype)
    res[valid] = var[pix]
    return res


def get_lonlat_nn_data(var, lonlat):
    """
    var: variable with lon and lat attributes (2d slice)
    lonlat: coordinates at which to get the data
    returns: values on the points in the plot grid.
    """
    var_xyz = lonlat_to_xyz(lon=var.lon.values.flatten(), lat=var.lat.values.flatten())
    tree = KDTree(var_xyz)

    valid = np.all(np.isfinite(lonlat), axis=-1)
    ll_valid = lonlat[valid].T
    plot_xyz = lonlat_to_xyz(lon=ll_valid[0], lat=ll_valid[1])

    distances, inds = tree.query(plot_xyz)
    res = np.full(lonlat.shape[:-1], np.nan, dtype=var.dtype)
    res[valid] = var.values.flatten()[inds]
    return res


def get_lonlat_meshgrid_nn_data(var, lonlat):
    """
    var: variable with lon and lat attributes (2d slice)
    lonlat: coordinates at which to get the data
    returns: values on the points in the plot grid.
    """
    return get_lonlat_nn_data(var.stack(cell=("lon", "lat")), lonlat)


def get_lonlat_for_plot_grid(nx, ny, ax=None):
    """
    nx: image resolution in x-direction
    ny: image resolution in y-direction
    ax: axis to plot on
    returns: coordinates of the points in the plot grid.
    """

    if ax is None:
        ax = plt.gca()

    xlims = ax.get_xlim()
    ylims = ax.get_ylim()
    xvals = np.linspace(xlims[0], xlims[1], nx)
    yvals = np.linspace(ylims[0], ylims[1], ny)
    xvals2, yvals2 = np.meshgrid(xvals, yvals)
    lonlat = ccrs.PlateCarree().transform_points(
        ax.projection, xvals2, yvals2, np.zeros_like(xvals2)
    )
    return lonlat


def lonlat_to_xyz(lon, lat):
    """
    lon: longitude in degree E
    lat: latitude in degree N
    returns numpy array (3, len (lon)) with coordinates on unit sphere.
    """

    return np.array(
        (
            np.cos(np.deg2rad(lon)) * np.cos(np.deg2rad(lat)),
            np.sin(np.deg2rad(lon)) * np.cos(np.deg2rad(lat)),
            np.sin(np.deg2rad(lat)),
        )
    ).T
The plot function#
def plot_map_diff(var, ref, colorbar_label="", title="", extent=None, **kwargs):
    """
    var: data set
    ref: reference data
    colorbar_label: label for the colorbar
    title: title string
    **kwargs: get passed to imshow
    returns figure, axis objects
    """
    projection = ccrs.Robinson(central_longitude=-135.5808361)
    fig, ax = plt.subplots(
        figsize=(8, 4), subplot_kw={"projection": projection}, constrained_layout=True
    )
    ax.set_global()
    if extent is not None:
        ax.set_extent(extent, crs=ccrs.PlateCarree())

    varmap = get_nn_data(var, ax=ax)
    refmap = get_nn_data(ref, ax=ax)
    imsh = ax.imshow(
        varmap - refmap, extent=ax.get_xlim() + ax.get_ylim(), origin="lower", **kwargs
    )
    ax.add_feature(cf.COASTLINE, linewidth=0.8)
    ax.add_feature(cf.BORDERS, linewidth=0.4)
    fig.colorbar(imsh, label=colorbar_label)
    plt.title(title)
    return (fig, ax)
fig, ax = plot_map_diff(
    icon_2d,
    fesom_2d,
    cmap="RdBu_r",
    vmin=-4,
    vmax=4,
    interpolation="none",
    colorbar_label="K",
    title=f"ICON SST - FESOM SST, {str(icon_2d.time.values)[:19]}",
)

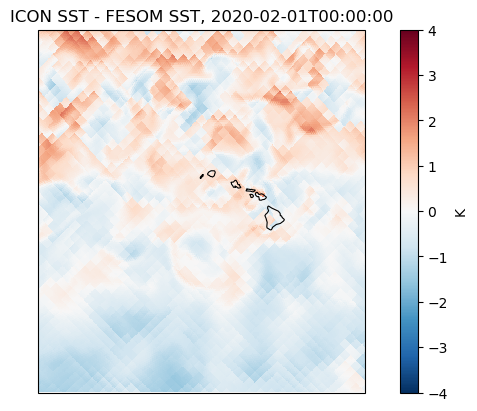
fig, ax = plot_map_diff(
    icon_2d,
    fesom_2d,
    cmap="RdBu_r",
    vmin=-4,
    vmax=4,
    interpolation="none",
    colorbar_label="K",
    title=f"ICON SST - FESOM SST, {str(icon_2d.time.values)[:19]}",
    extent=[-170, -150, 10, 30],
)

